Exploring Immigration and the American Dream for Chinese Immigrants in the San Francisco Bay Area
The American Dream is a throughline in the United States mythos: the idea that, regardless of your social, geographical, or economic background, hard work and perseverance will lead you to a better life in America. This idea has made the United States a country of immigrants.
Note: Each dot represents 10,000 people. Regions are defined by the U.S. Census Bureau.
For as long as this idea has existed, though, so too has the doubt that the American Dream is real. In this article, we focus on exploring the American Dream for one small subset of immigrants: those who moved from China to the San Francisco Bay Area. We follow these immigrants, as well as later generations of immigrants born in the United States to both immigrant and native-born parents.
Using Census data from March 2022 — the most recent available at the time of publication — this project only represents a small, static slice of the rich, complicated history that is immigration in the United States. However, we aim to showcase the larger trends in the data and analyze what that means for an average Chinese immigrant household today and their ability to achieve socio-economic success.
The Wangs
To start, we zoom in to focus on one typical example: an immigrant family from China who has settled in the Bay Area.
The parents, Jennifer and James Wang, are first-generation immigrants. This means they were born outside of the United States. Their daughter, Elizabeth, was born in the United States. That means she is a second generation immigrant. Elizabeth has a son, Daniel; he would be considered third-generation.
In our analysis, partly as a limitation of the Census data, we group Daniel together with all other native-born Bay area residents of Chinese descent born to native-born parents as third-or-later generation immigrants.
While many immigrants have stories like the Wang family, the story of this family in particular is a fictional narrative used as a tool to help highlight trends in the data.
Throughout this project, we will be analyzing the American Dream and testing its validity through four main component parts: Education, Occupation, Income, and Healthcare.
While we are aware that these four components are not a measure of success for every individual, these benchmarks were chosen based on completed and ongoing research of sociologists and anthropologists, as well as previous Census analysis, studying success and well-being in America for native-born citizens and immigrants alike.
Education
Jessica and James immigrated to the United States to attend college abroad, in the Bay Area. Let’s take a look at educational attainment across the generations. How do they fare compared to Elizabeth or her son, Daniel?
To understand educational attainment, we can compare the highest level of education achieved. For a fair comparison, we limit our data to adults who are not in school.
First, here is the percentage of first-generation immigrants who have achieved each level of education. The majority of first-generation immigrants have a post-secondary degree (i.e., they've graduated with an Associate's or Bachelor's degree).
Second generation immigrants have higher educational attainment: they all have receive at minimum primary education, and over 90 percent graduate high school.
In later generations, we see that educational attainment diminishes. A greater proportion of this generation have at least a primary or secondary education compared to the first generation. However, the number of those with college degrees decreases.
Compared to the general Bay Area population from the same dataset, we find that, although second generation immigrants have higher educational attainment than the general population, the same does not hold for later generations.
This matches findings from prior research, which finds that high first- and second-generation achievement stalls in later generations.
Within the Wang Family, Jessica and James graduated from an American university with Bachelor’s degrees, but they are not the norm for their generation. People in their daughter's generation are much likelier to graduate with a Bachelor's or post-graduate degree. The same is not true for those in their grandson Daniel's generation, who will have fewer high school and college graduates compared to their parents or their non-immigrant peers.
Occupation
James' father was an airplane mechanic; James moved to the United States to pursue a more prestigious career, and to provide more opportunities up the social ladder for his children. Next, let’s take a look at class and occupation across generations to see how they fare compared to Elizabeth or Daniel.
Trends similar to educational attainment also occur in the workforce. While first and second generation Chinese immigrants have a larger proportion of their respective populations working in white collar industries, that fraction falls for third and later generations compared to the general Bay Area population.
Note: Occupations were labeled as blue collar or white collar according to their major groups in the 2018 Bureau of Labor Statistics Standard Occupational Classification (SOC) system.
Jessica is a paralegal and James is a software engineer. Both work white collar jobs. Their daughter, Elizabeth, follows in her mother's footsteps and becomes a lawyer.
However, Elizabeth doesn't pressure Daniel to do the same. Daniel's generation of immigrants is more likely to work blue collar jobs, even more than his non-immigrant peers.
Income
The Bay Area is one of the most expensive places to live in the United States, with a high associated cost of living. One of the lures of working in the United States for Jessica and James was increased wages and greater class mobility. Next, let’s take a look at levels of income across generations to see how they fare compared to Elizabeth or Daniel.
We measure household income as the total pre-tax wage and salary income earned in the previous year. This contains all money received by an employee (e.g. wages, salaries, commissions, cash bonuses, tips, and other income received from an employer).
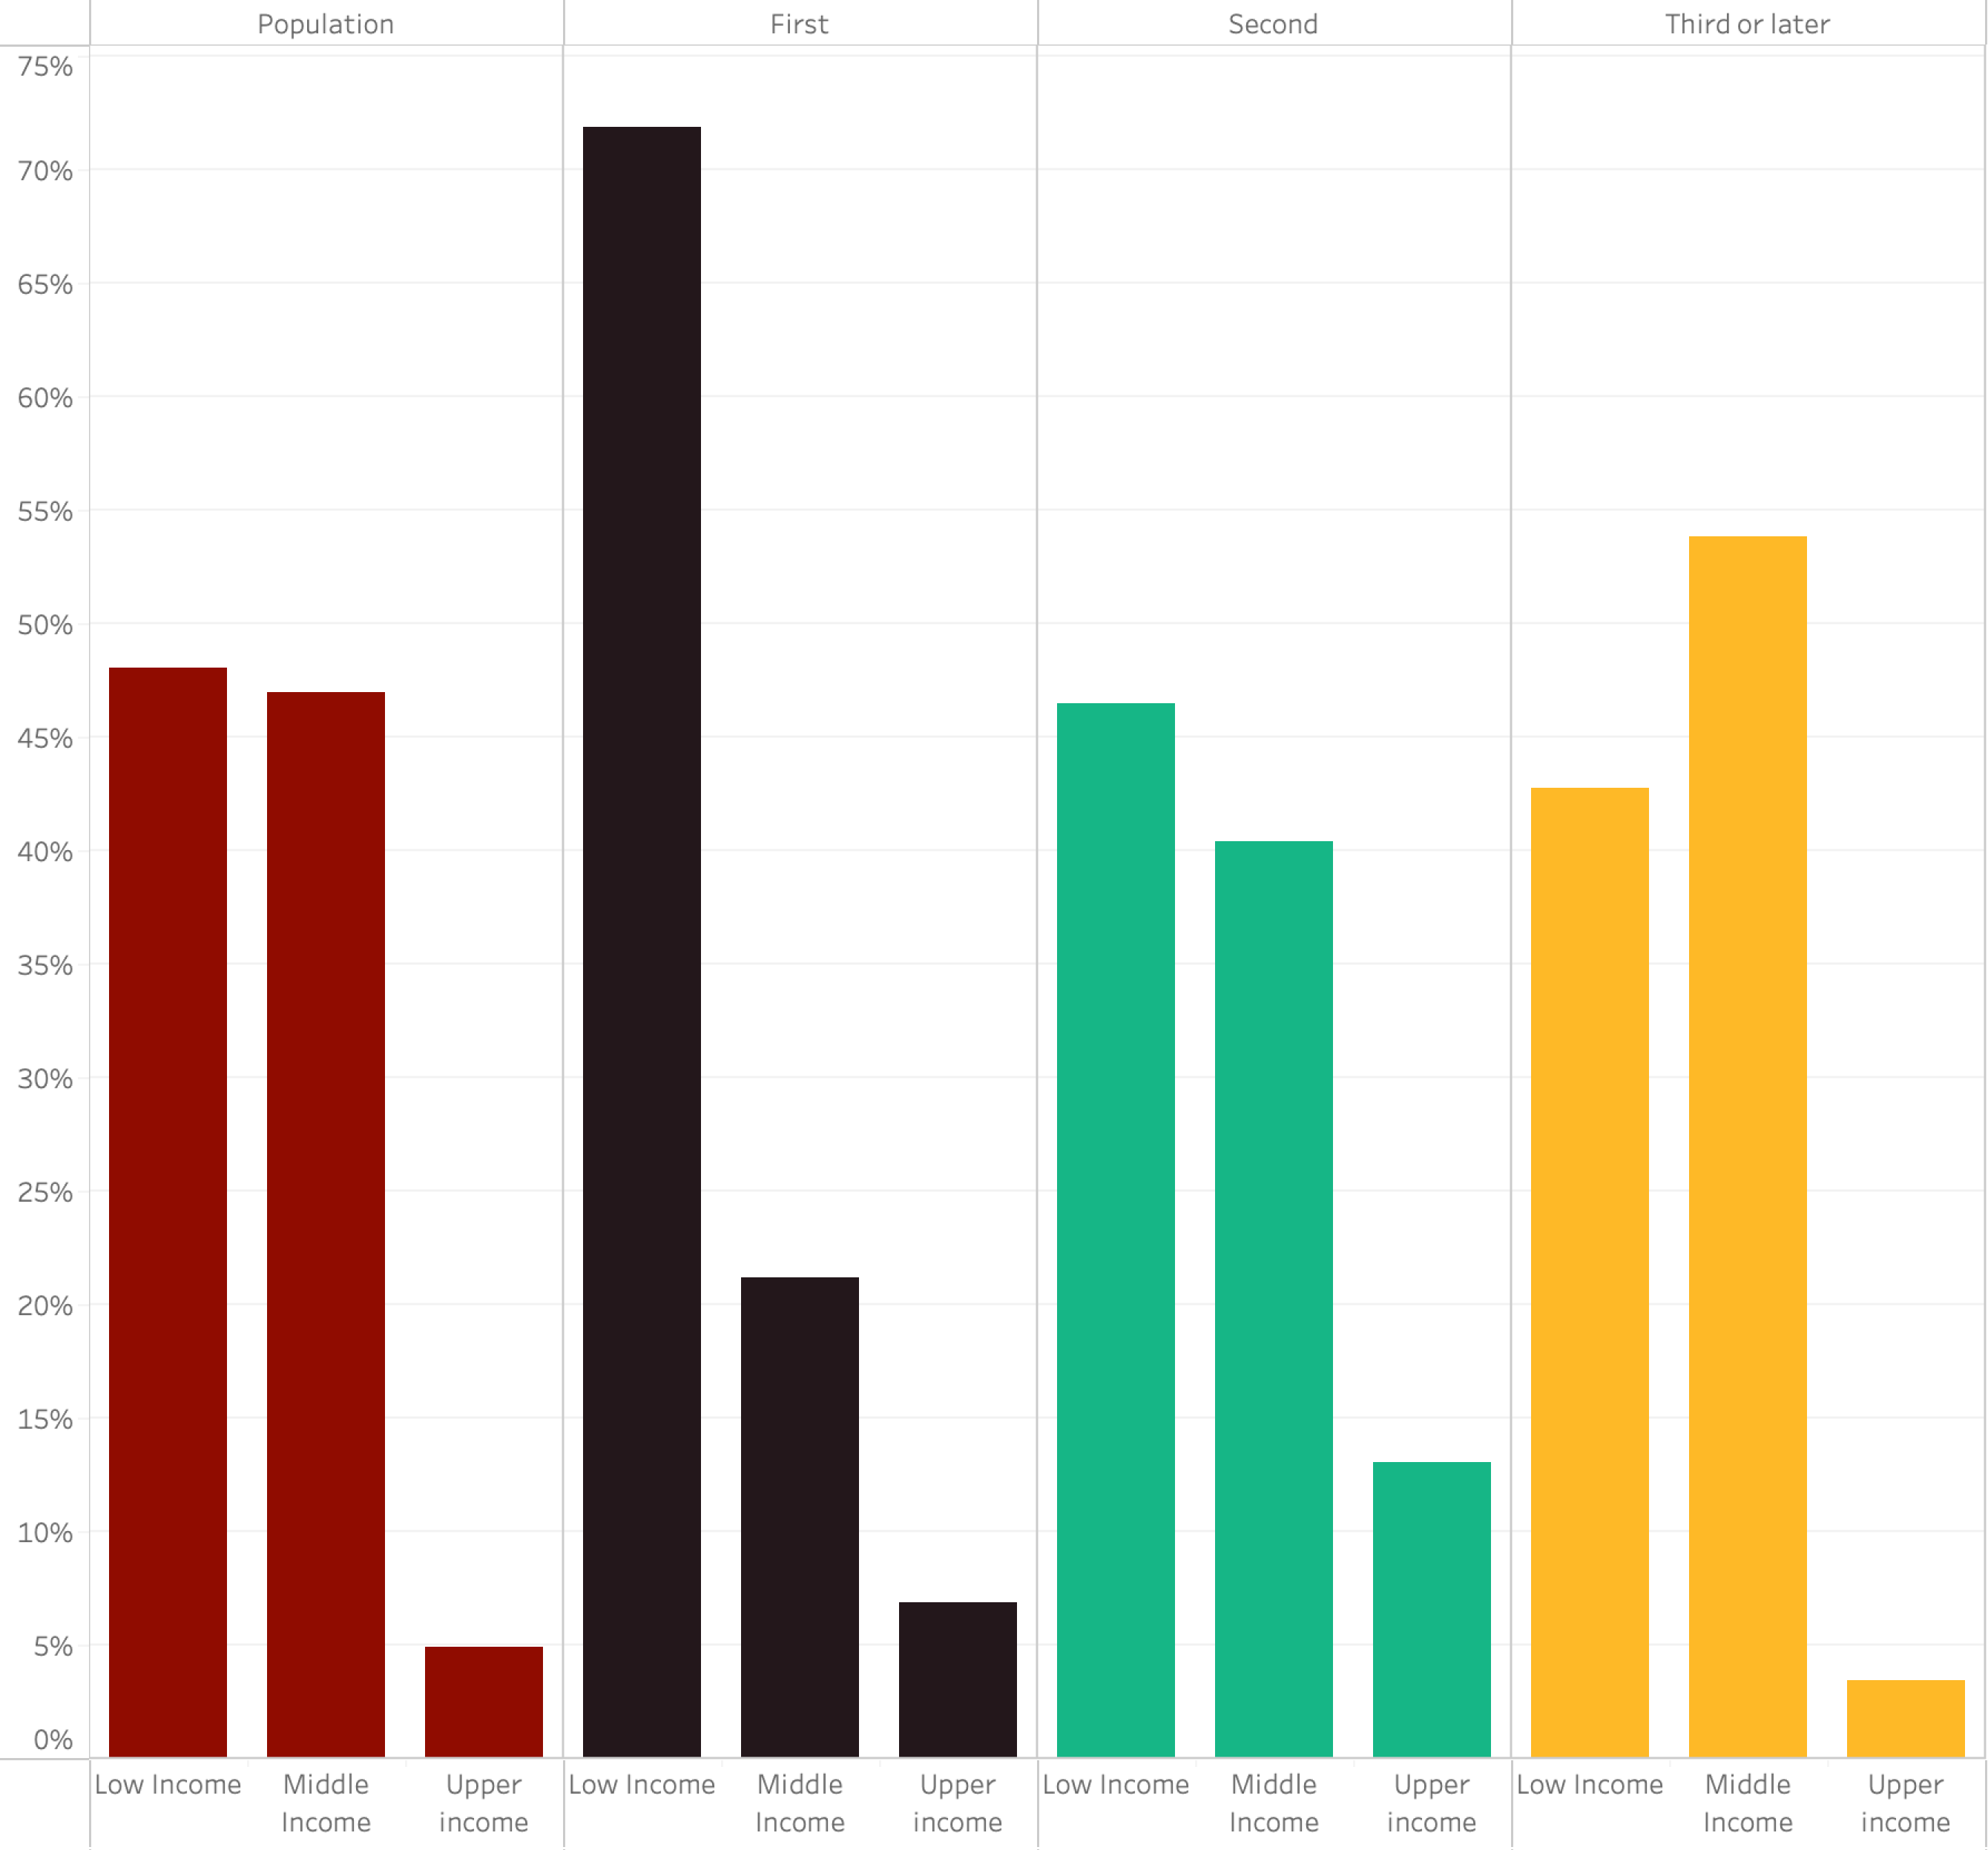
In the Bay Area, residents are most likely to be classed as low and middle income, regardless of immigration status.
Most members of the first generation are classed as low income. Compared to the general population, the middle class shrinks while the low income group grows. However, there are also more first-generation immigrants with upper-class income.
Looking at the upper class, we find a similar trend to education and occupational class: first- and second-generation immigrants outperform the general population while third-and-later generation immigrants fall short.
However, the lower income brackets tell a different story. Third-and-later generation immigrants have the most robust middle class and the smallest low-income group compared to both immigrants and the general population.
James and Jessica came to the Bay Area with career trajectories that already gave them a decent chance of becoming high-earners. However, as they are just starting out in a new country, they might not be able to make as much as someone with a more stable foundation. Elizabeth follows in their same footsteps, pursuing a white collar career in law. She is more likely than her parents to reach upper income, using the springboard of her parent’s status to overachieve.
Those in her son's generation are less likely to make it rich, but at the same time, most of them will be comfortably middle class..
Healthcare
Jessica has been injured in a car accident. After suffering with neck and back pain, she decides to go to the closest hospital’s Emergency Room for treatment. However, the United States is well-known for having a very high cost of care, which can be life-altering for residents who are underinsured or uninsured. In the last part of our analysis, let’s take a look at healthcare coverage across generations to see how they fare compared to Elizabeth or Daniel.
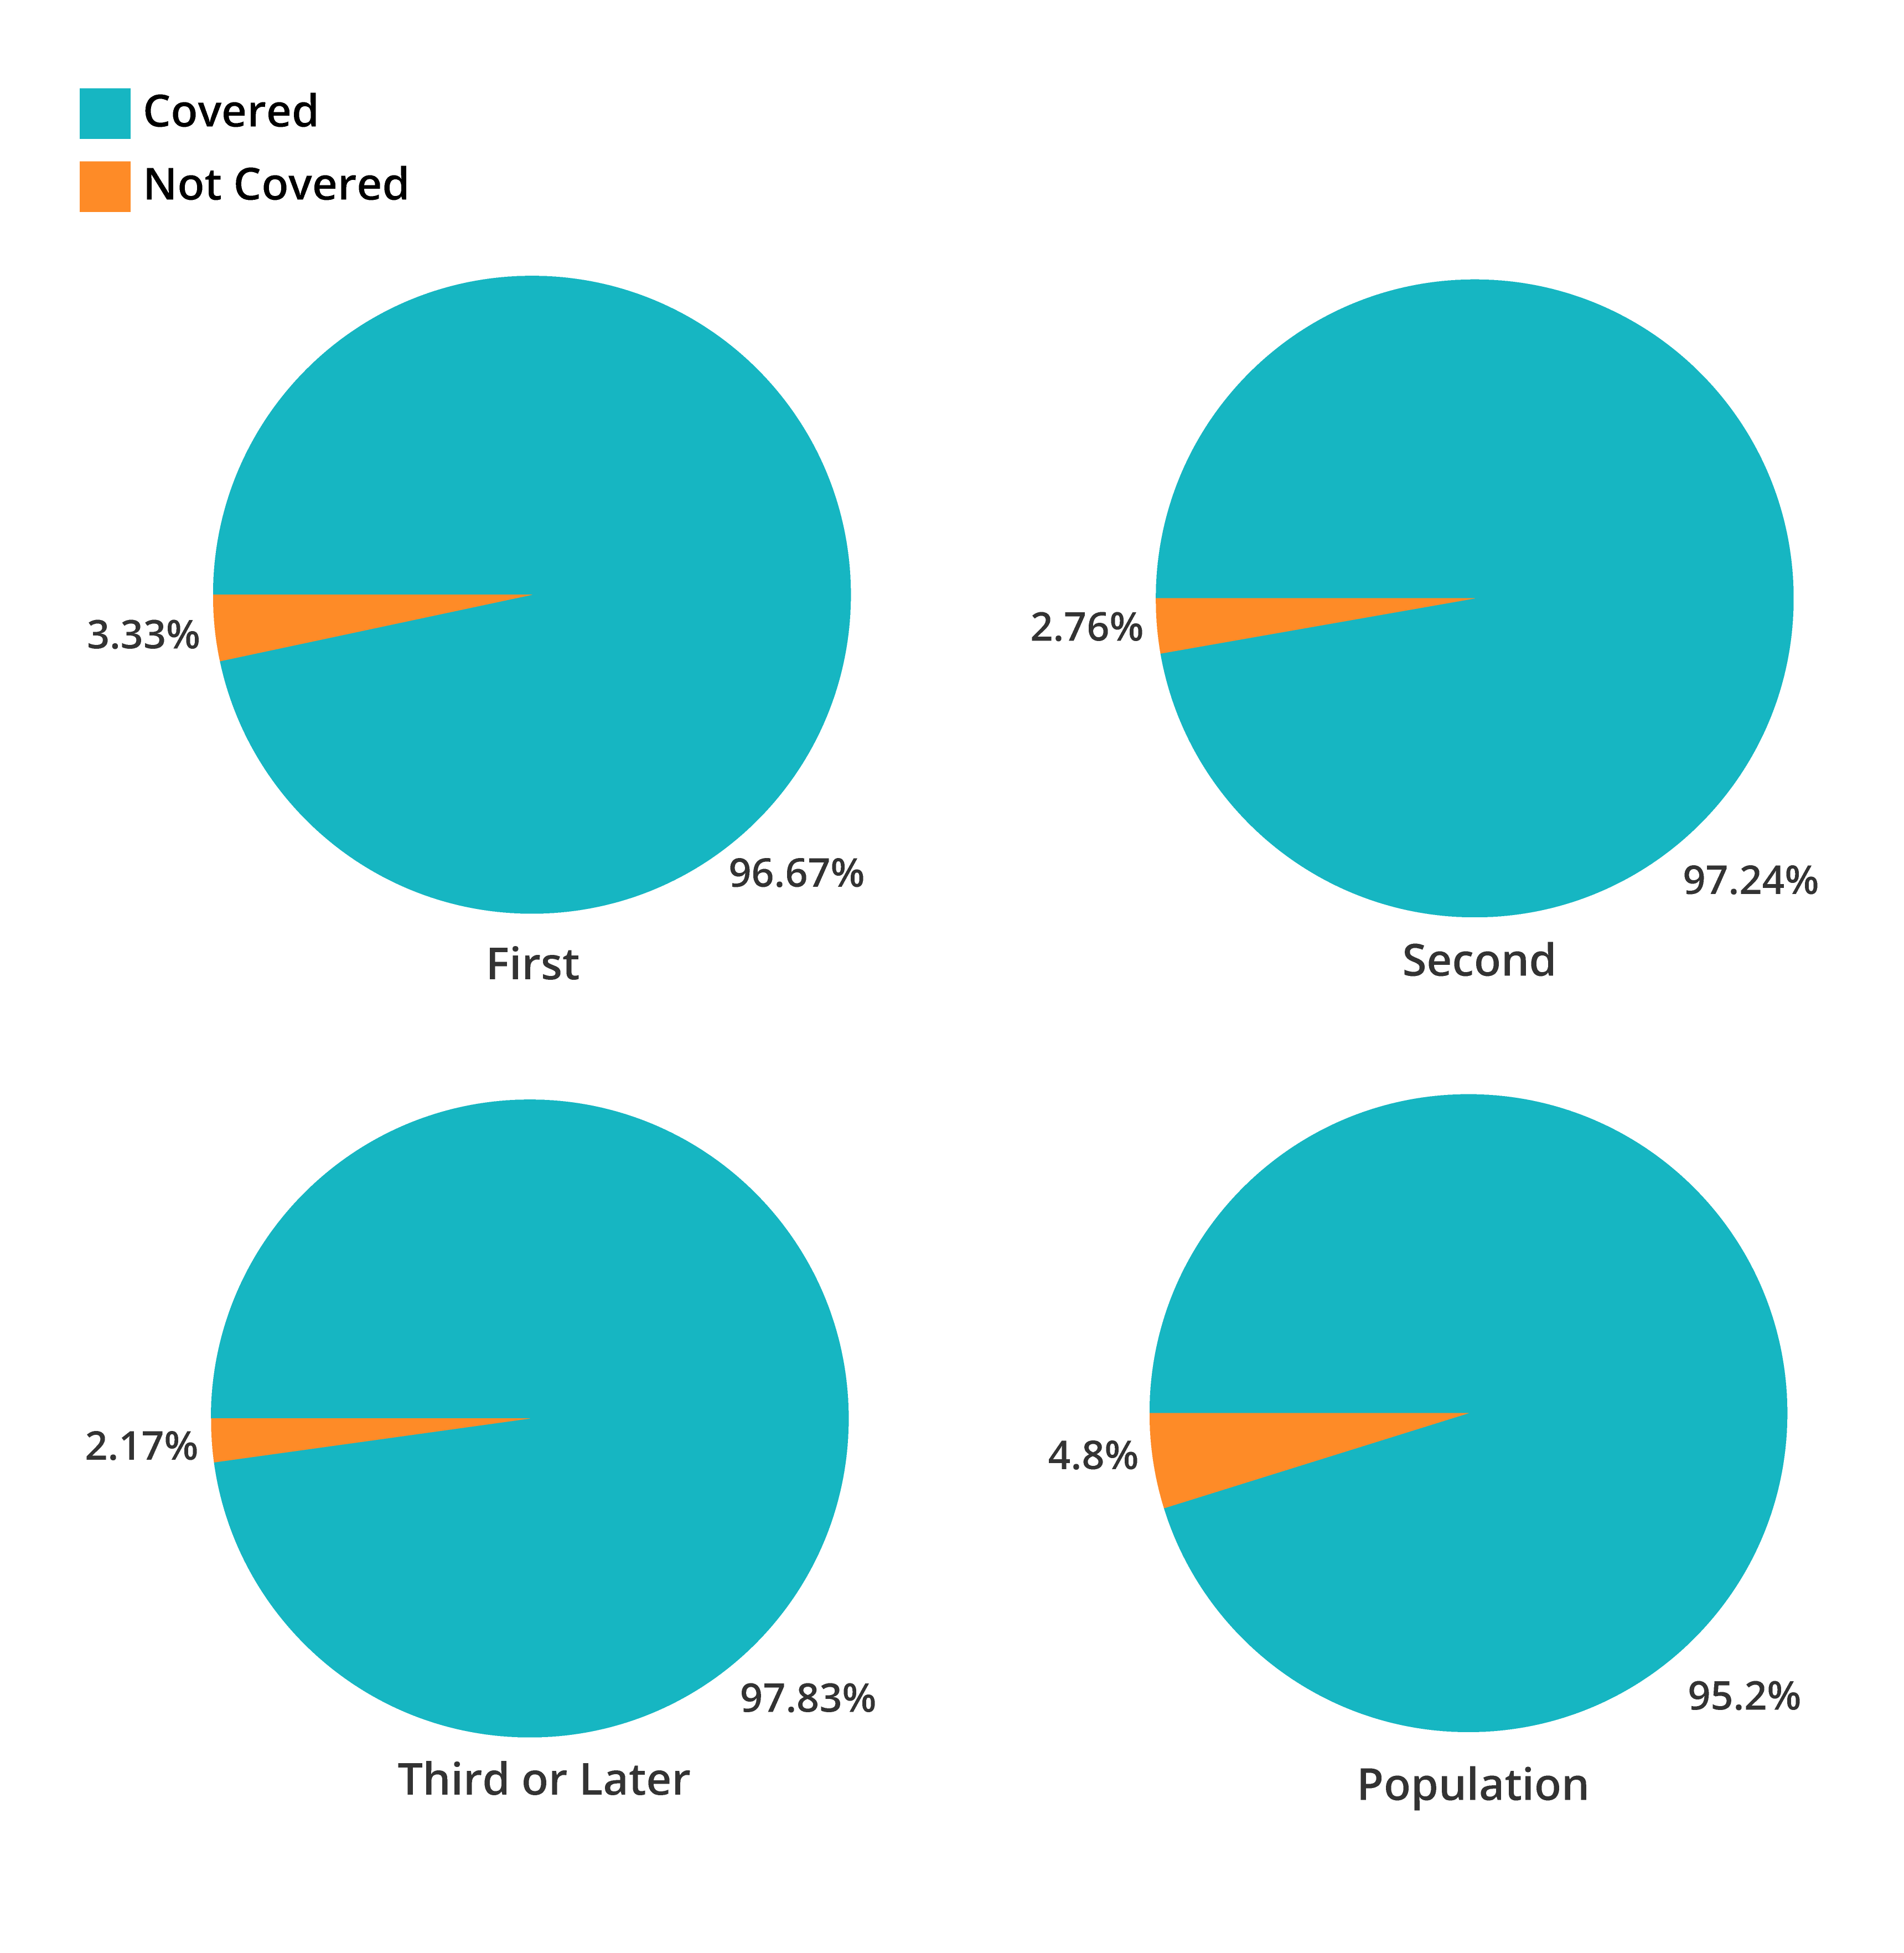
Healthcare coverage is measured through a household’s self-reporting. Coverage here is defined as holding any kind of healthcare insurance, including private insurance provided by an employer, Medicare, Medicaid, or US military insurance.
Across the board, Americans are well-insured; differences between generations and between immigration status are small.
That being said, immigrants more likely to have healthcare coverage than the general population, and the third generation and later are the best covered, though, again, the margin is small.
In the face of any medical needs, James, Jessica, Elizabeth, and Daniel all have a high likelihood of being able to get the care they need, despite their different upbringings. Daniel, especially, has the greatest access to healthcare, as the most likely in his family to be insured.
Conclusion
Success is a highly personal benchmark. For some, success means that they are working a job they enjoy. For others, it can mean earning a high salary in their chosen field. For others still, it rests in intangible measures and emotional indicators such as happiness.
We cannot measure if Chinese immigrants such as the Wang family and their future generations are successful as a monolith. However, recent Census data shows us that, when it comes to the American Dream, all generations of immigrants display a difference in their achievement of the four benchmarks analyzed in this article.
As Chinese immigrant families reach the third-generation and beyond, we see that the educational and occupational achievement displayed by the first generation, and then outperformed by the second, decreases. However, they have the most access to healthcare, and when it comes to economic achievement, we see mixed results.
There is a large shift towards immigrants of third generation and later achieving wages within middle-income, even more than the general population of the Bay Area and earlier immigrant generations. Yet, fewer members of these later generations are able to achieve the same upper-income status of their parents and grandparents.
While ultimately it is up to individuals to define their own success, the socioeconomic indicators analyzed in this article imply that the closer that Chinese immigrant families move towards assimilation, the less likely they are to overachieve within these measures, with the exception of healthcare coverage. They are less likely to attain postsecondary or postgrad education and are more likely to work Blue Collar jobs and earn middle-income salaries.
With the data and analysis we have, we can't make any claims as to why these trends exist. That remains an open question for future research. Perhaps there are systemic barriers that prevent later generations from reaching the same heights as their preceding generations. Or perhaps later generations simply have different goals in mind.
About the data: We used the Annual Social and Economic Supplement (ASEC) for the Current Population Survey for Social, Economic and Health Research (CPS) from the Census Bureau, because it has survey data on a variety of socioeconomic variables as well as foreign-born and parental birthplace information, which we can use to study immigrant generations. This is a nationally representative survey of the US population taken in March of every year.
We are using the March 2022 dataset, which is the most recent data for the ASEC. The Census provides both tabulations of the data and microdata, which contain responses from individuals, with disclosure avoidance techniques that prevent the identification of specific individuals. We use the microdata as prepared by the IPUMS project at the University of Minnesota, which processes datasets from a variety of national agencies and organizations and provides an interface to request subsets with specific variables.
To narrow the scope of the project, almost all of our analysis focuses on a smaller slice of the ASEC: Chinese immigrants to the San Francisco Bay Area. We chose this subset because of our familiarity with the immigrant population as well as the regional relevance of the immigrant destination, but with the awareness that this subset of immigrant stories is not representative of all immigrant stories (nor is that a feasible goal to pursue.)
Nyah Mattison and Naitian Zhou - INFO 247 Final Project (Spring 2023)